If you're going to value something based on its discounted cash flows, you're going to need a weighted average cost of capital (or an equity cost of capital) to apply to those cash flows. Duff and Phelps recently released a paper discussing the difficulty of determining the cost of capital in today's environment. Some of the problems they address:
Treasury yields (the risk free rate in CAPM) are temporarily low due to liquidity concerns and a flight to quality, understating risk. It is difficult to decompose treasury yields into components of real return, inflation expectations, and reinvestment risk.
The expected equity risk premium (ERP) has increased greatly (as evidenced by the massive decline in stock prices). However, they claim the equity risk premium ranges from 3.5% to 6.0% throughout the business cycle, which seems extremely low to me. We are not in a normal business cycle here, so I think the forward-looking ERP must be higher than 6%.
Declines in financial stocks and companies with high leveraged have outpaced the broader market, leading to a misleading beta calculation that implies risk has actually declined. Beta measures the covariance of a stock's returns with the market's returns. The market had become overweighted with financial stocks that dragged the index down as they declined. So if you compare a non-financial company's stock covariance to the pre-crash market versus its post-crash covariance, it will appear to have decreased, leading to a lower beta. They recommend using a sum beta calculation to correct for this.
Highly levered companies will probably be unable to sustain their debt loads going forward. The cost of capital needs to reflect likely changes to the capital structure over time. Alternately, you could use an approach like adjusted present value (APV) which separates out the value of the tax shields.
Companies operating with substantial losses may not be able to take advantage of the tax shield on interest in the period when it is paid. So the after-tax cost of debt capital may be inappropriate.
Their final recommendation is that any cost of capital calculation must also pass the reasonableness test. Most of these issues stem from the fact that finance theory attempts to use past data to predict future performance. That becomes increasingly hard to justify during times of discontinuous change, such as the one we're experiencing now. For more information, the authors of this paper have published a practitioner's guide to the cost of capital, available at Amazon.


Mar 30, 2009
Regressions everywhere you look
Is there anything more enjoyable than putting your feet up, opening Excel, gathering data, and running regressions? Of course not. Let's take a look at household energy consumption as a function of cooling degree days (CDD). Cooling degree days are calculated by subtracting 65 from a day's average temperature. For example, if the day's high is 90°F and the day's low is 70°F, the day's average is 80°F. Eighty minus 65 is 15 cooling degree days. There's a similar measure for heating degree days. This data is used for a variety of purposes, including weather futures (derivatives tied to temperature allow utilities to hedge exposure to fluctuating weather). Recent data has put Dallas, TX squarely in climate zone five, with around 3200 CDD and 1800 HDD annually. Here's a nice graph of the country by climate zone:


Our gas bill is larger in the winter. This time, a linear regression of heating degree days against gas consumption in thousand cubic feet had the best fit with the data.

- CDD less than 2000, HDD greater than 7000
- CDD less than 2000, HDD between 5500 and 7000
- CDD less than 2000, HDD between 4000 and 5499
- CDD less than 2000, HDD fewer than 4000
- CDD greater than 2000, HDD fewer than 4000

Our gas bill is larger in the winter. This time, a linear regression of heating degree days against gas consumption in thousand cubic feet had the best fit with the data.

Mar 27, 2009
A graphical representation of social security's problems

Takeaway: in 1940, social security offered retirement at age 65 - but the average person didn't even live that long. 60 years later, social security's retirement age was unchanged, but the average person lived 75 years. No wonder the program is perpetually on the brink of insolvency. If a life insurance company operated this way, it would've gone bankrupt long ago. (As an aside, it would be interesting to examine purchasing power of social security benefits from 1940 versus 2000.)
This is from a 2003 paper on Demographics and Capital Market Returns that looks at the coming generational conflict between younger workers and older retirees as a result of the shifting "dependency ratio." This has serious implications for investors, who may see declining demand for stocks as people sell assets in retirement and not enough younger workers willing/able to purchase them. Their (optimistic?) conclusion is that retirement will be unaffordable at age 65 for most baby boomers, and therefore they'll keep working until their early 70s. The potential ameliorating effects of immigration, productivity, global trade, and social security reform are all discussed.
Mar 26, 2009
Personal investment preferences by country
Much has been said about Americans' low savings rate, usually less than 1% in recent years. As with most numbers that get a lot of press time because they sound impressive ($60 trillion in credit default swaps? Excuse me, but that's a notional value, not the actual value of the contracts), it's a misleading statistic. It doesn't count saving in 401(k)s and IRAs. It also gives too much weight to retirees who spend more than their income by selling assets in their portfolio. It doesn't account for the amortization of durable goods - if you buy a car, the entire cost is counted as spending in the year of purchase when in fact, you will likely use that car for several years. Depreciation on houses is also counted as spending and this "expense" increased substantially as house values rose. However, no credit was given to households for the appreciation of their real estate. Granted, a lot of that appreciation was phantom wealth, but even so, over the long term we should expect house values to increase roughly in line with inflation. If you're going to count non-cash expenses like depreciation then you should also count unrealized capital gains as income. Once you correct for all of these factors, Americans' savings rate is actually several points higher than the reported number.
So how do Americans invest their savings compared to citizens of other countries? Here's a graph from a slightly dated report on household investments by country. Not surprisingly, we have the highest proportion of our wealth tied up in equities.

More detailed statistics on US household investment preferences is available from the Census:

So how do Americans invest their savings compared to citizens of other countries? Here's a graph from a slightly dated report on household investments by country. Not surprisingly, we have the highest proportion of our wealth tied up in equities.

More detailed statistics on US household investment preferences is available from the Census:

Mar 25, 2009
Spending in retirement: The 4% rule
Bill Sharpe et. al. prepared an interesting analysis of The 4% Rule (At What Price?) that examines the traditional advice given to retirees: plan on spending 4% of your initial 60% stock/40% bond portfolio every year in retirement to acheive a >90% success rate (confidence interval) of having enough money for the rest of your life. The 4% rule is parroted by many retail investment advisers - and therefore, "it behooves us to be familiar with the rule’s approach, features, and flaws." They find that this strategy, while popular, is suboptimal in terms of overpayments and surpluses (i.e. you are paying more than you need to or spending less than you could). Common modifications to the plan, such as adjusting spending depending on market returns (also known as the glide-path strategy), don't do much to remedy the situation. Part of the problem lies in the fundamental mismatch between the cash flows - the investor seeks a constant stream of payments while the portfolio's returns are variable.
The authors make an interesting comparison between the risky investor that buys stocks and bonds versus one that guarantees his retirement spending by buying zero-coupon inflation-index government bonds (TIPS). For the very risk averse investors, this 100% TIPS portfolio provides the highest utility and dominates other investment strategies. This is an application of financial economics. Investors that are willing to take on more risk with a stock/bond portfolio can still achieve a higher utility by moving away from the 4% rule. But the riskless portfolio provides a minimum cost option that all other investment/spending plans should be judged against.
What does all this mean? Basically, that blind adherence to the 4% rule is inefficient. Unfortunately the paper stops short of developing a new framework that takes into account investors' preferences. However, it does conclude that once surpluses or overpayments are identified, they can be appropriately valued, which is the first step towards improving the spending and investing decisions.

This graph plots the static 4% rule at point A for an investor that has $100 to pay for a retirement plan. You can clearly see that an individual would prefer other points under the curve. Depending on their risk tolerance, they might move up and obtain a higher utility for the same cost, or move to the left and get the same benefits for less cost.
The authors make an interesting comparison between the risky investor that buys stocks and bonds versus one that guarantees his retirement spending by buying zero-coupon inflation-index government bonds (TIPS). For the very risk averse investors, this 100% TIPS portfolio provides the highest utility and dominates other investment strategies. This is an application of financial economics. Investors that are willing to take on more risk with a stock/bond portfolio can still achieve a higher utility by moving away from the 4% rule. But the riskless portfolio provides a minimum cost option that all other investment/spending plans should be judged against.
What does all this mean? Basically, that blind adherence to the 4% rule is inefficient. Unfortunately the paper stops short of developing a new framework that takes into account investors' preferences. However, it does conclude that once surpluses or overpayments are identified, they can be appropriately valued, which is the first step towards improving the spending and investing decisions.

This graph plots the static 4% rule at point A for an investor that has $100 to pay for a retirement plan. You can clearly see that an individual would prefer other points under the curve. Depending on their risk tolerance, they might move up and obtain a higher utility for the same cost, or move to the left and get the same benefits for less cost.
Mar 20, 2009
What is the purpose of the capital markets?
- To allow for the efficient allocation of capital across industries, and by extension, society as a whole.
- To enable income smoothing over time by letting some borrow from future earnings for consumption today and others lend today in the hopes of higher consumption in the future.
Mar 19, 2009
Objective 401k ratings
BrightScope has a website where you can search for evaluations of employer's 401k plans. They provide an overall rating as well as a comparison to the peer group on dimensions such as employer match, investment options, and participation rate. Perhaps the most interesting number is the average account balance by employee, which ranges from a few thousand dollars to close to a million.


Mar 18, 2009
Personal Finance with Zvi Bodie: The Conventional Wisdom is Wrong
Here's a nice set of videos from my favorite finance professor, Zvi Bodie, where he challenges the conventional wisdom about stock market investing. For a more thorough discussion of his safe investment philosophy, I recommend his book: Worry Free Investing. It's written for a non-academic audience and is fairly accessible even if you're not familiar with CAPM. The first chapter is available as a sample from Bodie's website here.
Mar 17, 2009
The next bubble to burst: higher education
Bloomberg and the New York Times recently confirmed what I have believed for several months now: higher education is the next bubble to burst. Applications at non-Ivy League schools are declining. Private college expenses have increased at a rate far above inflation for too long, and households are no longer willing nor able to tap an inexhaustible supply of home equity to pay $150,000 for a bachelors degree that will not even guarantee a decent wage. Meanwhile, colleges felt the wealth effect as endowments rose and they embarked on grandiose construction plans, often building dorms that would fit in better at the country club than an educational institution. A recent study of university salaries found over 200 presidents making more than $500,000 per year.
As with most things in our economy over the last few years, all of this growth was fueled by cheap debt. An investment in education became one of the most highly leveraged investments you could make (100% financing implies an infinite debt-to-equity ratio). Just as people believed house prices could never go down, they felt that any college degree was worth its price. Obviously, not everyone should be an accountant - but you can justify the $150,000 price tag for an accounting degree much easier than you can justify $150,000 for an art history major. The long-term trend will be massive trading-down in the market for education: those considering private schools will switch to quality in-state public universities, and those who formerly considered state schools will move down to community colleges. Ivy League schools will always be in demand, but they'll have a harder time affording the financial aid they have committed to maintain an economically diverse student body. State universities that have unnecessarily committed to becoming a research institution will also have to scale back their plans.
Ultimately, a return to rational pricing is a good thing. Higher education was becoming unaffordable for an increasing percentage of households. State universities need to focus on their core mission of providing affordable high quality undergraduate education.
As with most things in our economy over the last few years, all of this growth was fueled by cheap debt. An investment in education became one of the most highly leveraged investments you could make (100% financing implies an infinite debt-to-equity ratio). Just as people believed house prices could never go down, they felt that any college degree was worth its price. Obviously, not everyone should be an accountant - but you can justify the $150,000 price tag for an accounting degree much easier than you can justify $150,000 for an art history major. The long-term trend will be massive trading-down in the market for education: those considering private schools will switch to quality in-state public universities, and those who formerly considered state schools will move down to community colleges. Ivy League schools will always be in demand, but they'll have a harder time affording the financial aid they have committed to maintain an economically diverse student body. State universities that have unnecessarily committed to becoming a research institution will also have to scale back their plans.
Ultimately, a return to rational pricing is a good thing. Higher education was becoming unaffordable for an increasing percentage of households. State universities need to focus on their core mission of providing affordable high quality undergraduate education.
Mar 16, 2009
A review of Wal-Mart's $2.97 wine: Oak Leaf Cabernet Sauvignon
Is it possible to produce and distribute a quality bottle of wine for under $3? California residents are probably familiar with Trader Joe's "Two Buck Chuck" but those of us further east were out of luck until recently. I spotted several varieties of Oak Leaf vineyards wine at my local Wal-Mart all selling for $2.97: Cabernet Sauvignon, Merlot, Chardonnay, Pinot Grigio, and Zinfandel. These wines sell for $2.00 in CA; supposedly the extra dollar covers added transportation costs. The economics of this wine are indisputable; consider how it compares to some other common beverages:
All three preferred the Blackstone to the Oak Leaf. They commented that it had more fruit flavor, a darker color, and possessed a more substantial mouthfeel. The Oak Leaf's bouquet had a slightly earthy tone that not everyone was fond of. One person gave Oak Leaf a point for its lower alcohol content. Another felt that it was just a little too watered down. However, no one would object if they were served the Oak Leaf; everyone regarded it as a perfectly drinkable wine, especially when served with a meal (that is to say, Oak Leaf would probably not be a great choice for a cocktail party). The Oak Leaf would also be a fine choice for cooking or any kind of mixed wine like Sangria. Ultimately, while this wine delivers some value given its price point, it's not one I would regularly purchase.

- 2 liter Coke: $0.02/oz
- Ocean Spray cranberry juice: $0.05/oz
- Oak Leaf wine: $0.12/oz
- Starbucks drip coffee: $0.17/oz
All three preferred the Blackstone to the Oak Leaf. They commented that it had more fruit flavor, a darker color, and possessed a more substantial mouthfeel. The Oak Leaf's bouquet had a slightly earthy tone that not everyone was fond of. One person gave Oak Leaf a point for its lower alcohol content. Another felt that it was just a little too watered down. However, no one would object if they were served the Oak Leaf; everyone regarded it as a perfectly drinkable wine, especially when served with a meal (that is to say, Oak Leaf would probably not be a great choice for a cocktail party). The Oak Leaf would also be a fine choice for cooking or any kind of mixed wine like Sangria. Ultimately, while this wine delivers some value given its price point, it's not one I would regularly purchase.

Mar 14, 2009
Texas: A very sticky state
A new study from the Pew Research Center ranks Texas as the country's stickiest state, meaning that it has the highest percentage population of native born citizens who are still here (75.8%). Texas doesn't rank as high on the magnet scale, which measures how strongly it attracts transplants from other states, but this metric is somewhat distorted because the organic population growth and retention rate is so high, on a relative basis it dwarfs the immigration we do have.


Mar 13, 2009
A Week on Wall Street: Day 5
New York Federal Reserve
Truly staggering to see the Fed's balance sheet balloon up from ~$800 billion to +$2.5 trillion over the last few months. And I don't think that includes many of the loan guarantees (e.g. the government backstop of $300B of Citigroup debt) that have taken the form of off-balance sheet contingent liabilities. The Fed is still serving up hot steaming bowls of "alphabet soup" - more acronyms for funding programs than we know what to do with. Another frightening comment from our speaker: when the time comes to reign in all that liquidity, its going to be very difficult to do it in an orderly manner. Many of the outstanding commitments are tied to short term obligations, which will run off in due course. But what about mortgages that could take +10 years to amortize? If those securities are unmarketable, the Fed will have no choice but to hold them to maturity, leaving the money supply inflated for quite a while. Our speaker was also light on details about the Fed's exit strategy.
We toured the gold vault which holds the largest cache of gold in the US (larger than the US Bullion Depository at Ft. Knox). 80 feet below street level, the vault has a massive rotating door that forms a watertight seal at night to protect all the sovereign gold that we hold for other countries. This is a free service of the government. The vault looks nothing like what was pictured in Die Hard.
CNBC
Driving out to New Jersey, we tour the studio and meet with one of the on-air commentators from the news network that everyone loves to hate. Our host is one of the more reasonable talking heads and he comments on how a dedicated financial press is a relatively recent innovation (occurring the last 25 years).
Returning home, the flight was only at 75-80% capacity. Surprising, given the capacity cuts that have already taken place.
Truly staggering to see the Fed's balance sheet balloon up from ~$800 billion to +$2.5 trillion over the last few months. And I don't think that includes many of the loan guarantees (e.g. the government backstop of $300B of Citigroup debt) that have taken the form of off-balance sheet contingent liabilities. The Fed is still serving up hot steaming bowls of "alphabet soup" - more acronyms for funding programs than we know what to do with. Another frightening comment from our speaker: when the time comes to reign in all that liquidity, its going to be very difficult to do it in an orderly manner. Many of the outstanding commitments are tied to short term obligations, which will run off in due course. But what about mortgages that could take +10 years to amortize? If those securities are unmarketable, the Fed will have no choice but to hold them to maturity, leaving the money supply inflated for quite a while. Our speaker was also light on details about the Fed's exit strategy.
We toured the gold vault which holds the largest cache of gold in the US (larger than the US Bullion Depository at Ft. Knox). 80 feet below street level, the vault has a massive rotating door that forms a watertight seal at night to protect all the sovereign gold that we hold for other countries. This is a free service of the government. The vault looks nothing like what was pictured in Die Hard.
CNBC
Driving out to New Jersey, we tour the studio and meet with one of the on-air commentators from the news network that everyone loves to hate. Our host is one of the more reasonable talking heads and he comments on how a dedicated financial press is a relatively recent innovation (occurring the last 25 years).
Returning home, the flight was only at 75-80% capacity. Surprising, given the capacity cuts that have already taken place.
Mar 12, 2009
A Week on Wall Street: Day 4
Dynamic Credit Partners
This firm is an expert in dealing with CDOs, toxic or otherwise. Our host took us through the process of creating such an investment and explained how a bank could take $100 of bonds, repackage them to appeal to investors' different maturity/credit preferences, and create securities worth $102 (the $2 was kept as profit for the bank). We examined a pitchbook for one deal that went south rather quickly, the collateral in the CDO was 95% subprime residential mortgage backed securities (RMBS). Whoops! Although the pitchbook had several pages of boilerplate on the various risks of the investment, there was no real analysis of which risks were the most important. A possible justification for lawsuits - investors in the subordinated classes (e.g. below the A tranche) were not informed that their cash flows could be diverted to the senior tranches if the collateral was downgraded by the ratings agencies. This was surprising to me, because why should the lower tranches suffer as long as the collateral was still performing? But that's what the waterfall of cash flows called for. The CDO we looked at had 6 tranches, and currently 5 of those tranches were non-performing and completely worthless. The top-rated A tranche was trading for 7 cents on the dollar.
Barron's
It would be hard to mistake Barron's offices for the well-appointed accommodations of any of the investment firms we visited - it had the appearance of a threadbare newsroom. Tough times for the print media in general, and the financial press is no exception. Demographic shifts - the average age of a Barron's reader is over 50. There is no doubt that investors will keep getting older, but eventually they'll consume content in electronic form only. Bad news for Barron's (and the rest) - rates for online ads have always been less than print ads, but it was hoped the two prices would converge around the average of the two. Instead, they're converging at the substantially lower online rate. Maybe they can clawback some of this differential with better targeted ads?
Cowen and Company
Although business was holding up better than many other firms here, the outlook here was quite pessimistic. Expenses are being cut to the bone - as is prudent - but if everyone cuts expenses until "things start to turn around" it seems the entire economy could easily get trapped in a deflationary spiral.
Completely unsubstantiated rumor of the day: Madoff will plead guilty to everything - the only thing he wants in return is protective custody in jail for the rest of his live, because many of the billions of dollars he is alleged to have lost belonged to organized crime syndicates/drug cartels in South America and Europe. It is an understatement to say they are unhappy with his investment performance and would likely seek to have him killed in prison.
Random observation: under normal circumstances, labor is a cheaper input than capital. In recent history, capital became cheaper than labor, which led to rampant inflation of investment bankers' salaries. The huge profits recorded in good years were actually returns to capital, not labor, but bonuses were paid out anyway.
Overall mood: approaching maximum bearishness.
This firm is an expert in dealing with CDOs, toxic or otherwise. Our host took us through the process of creating such an investment and explained how a bank could take $100 of bonds, repackage them to appeal to investors' different maturity/credit preferences, and create securities worth $102 (the $2 was kept as profit for the bank). We examined a pitchbook for one deal that went south rather quickly, the collateral in the CDO was 95% subprime residential mortgage backed securities (RMBS). Whoops! Although the pitchbook had several pages of boilerplate on the various risks of the investment, there was no real analysis of which risks were the most important. A possible justification for lawsuits - investors in the subordinated classes (e.g. below the A tranche) were not informed that their cash flows could be diverted to the senior tranches if the collateral was downgraded by the ratings agencies. This was surprising to me, because why should the lower tranches suffer as long as the collateral was still performing? But that's what the waterfall of cash flows called for. The CDO we looked at had 6 tranches, and currently 5 of those tranches were non-performing and completely worthless. The top-rated A tranche was trading for 7 cents on the dollar.
Barron's
It would be hard to mistake Barron's offices for the well-appointed accommodations of any of the investment firms we visited - it had the appearance of a threadbare newsroom. Tough times for the print media in general, and the financial press is no exception. Demographic shifts - the average age of a Barron's reader is over 50. There is no doubt that investors will keep getting older, but eventually they'll consume content in electronic form only. Bad news for Barron's (and the rest) - rates for online ads have always been less than print ads, but it was hoped the two prices would converge around the average of the two. Instead, they're converging at the substantially lower online rate. Maybe they can clawback some of this differential with better targeted ads?
Cowen and Company
Although business was holding up better than many other firms here, the outlook here was quite pessimistic. Expenses are being cut to the bone - as is prudent - but if everyone cuts expenses until "things start to turn around" it seems the entire economy could easily get trapped in a deflationary spiral.
Completely unsubstantiated rumor of the day: Madoff will plead guilty to everything - the only thing he wants in return is protective custody in jail for the rest of his live, because many of the billions of dollars he is alleged to have lost belonged to organized crime syndicates/drug cartels in South America and Europe. It is an understatement to say they are unhappy with his investment performance and would likely seek to have him killed in prison.
Random observation: under normal circumstances, labor is a cheaper input than capital. In recent history, capital became cheaper than labor, which led to rampant inflation of investment bankers' salaries. The huge profits recorded in good years were actually returns to capital, not labor, but bonuses were paid out anyway.
Overall mood: approaching maximum bearishness.
Mar 11, 2009
A Week on Wall Street: Day 3
New York Stock Exchange
It was a rare treat to go down to the trading floor of the NYSE for the opening bell. Although the vast majority of trading has gone electronic, they still have specialists for many stocks that manually open and close the trading day. The specialist we talked to seemed to base trading decisions on split second gut reactions and news events - there was no time for any kind of fundamental analysis or even technical analysis (one screen had a chart on it, but he didn't seem to rely on it much). Interestingly, these market makers get paid by the exchange for providing liquidity. There were also mad swarms of people running around writing down the expected opening price from the specialists, which was then sent upstairs. There is an electronic feed that provides similar information, but apparently this manual one is more accurate (one of the advantages of having a seat on the exchange is that you can get better pre-market information). Sadly, I learned that the funny looking colored jackets used to be used to identify different positions on the floor, but have since been made unnecessary (though many still wear theirs).
The NYSE gave us a sales pitch on how companies list on their exchange because they want to co-brand themselves. I'm skeptical that this is a prominent consideration when a company lists itself today - the increases competition with Nasdaq over fees has certainly had an impact on the NYSE. In the next 10 years, it would not surprise me if the trading floor was gone all together. Or, the room will be filled with actors hired by CNBC so they can still claim to be reporting from the middle of the action - a live shot of a room full of servers is less glamorous, but more likely where the real trading action is taking place.
WL Ross
It's not everyday that you get to meet a legend in the industry, so we were understandably impressed by Wilbur Ross and one of his managers. These guys were sharp. It is not an exaggeration to claim that before they make an investment, they know more about the company than its own CFO. They have the patience to wait and not bid up deals when dumb money is rushing in. They are also prudent about leverage - if a deal needs a ton of leverage to work, then you're probably paying too much for it. If they think it's an attractive opportunity, they'll consider restructuring an entire industry (such as the entire US steel market). If I could invest with anyone we met this week, it would be this firm.
Oppenheimer Funds
A quantitative fund manager and his team spoke to us about their fund. They have a multi-factor model with almost 100 inputs. They do a lot of back testing. They revise their model periodically. Overall, they seemed like intelligent guys. You'd think that all this fancy math would remove human emotion and mistakes from the investment process - but all of this quantitative analysis eventually came down to which factors they thought would best predict future performance. Given that their fund has been lagging its benchmark, I find it hard to believe that these guys have any edge in factor selection (despite their overall level of intelligence and sophistication). They were unwilling to engage in a discussion of active versus passive management, although they did mention that one of their small cap funds had about 1200 holdings in it (that sounds a lot like a closet index fund, with a higher expense ratio). A cynical observer might note that active management fees do provide for well appointed office space.
The old debate about active versus passive management really fascinates me. Generally, I believe that the market for public equities in the US is pretty efficient. It is exceedingly difficult to earn abnormal risk-adjusted returns of any substantial magnitude over the long run. The statistics regarding active mutual funds that fail to outperform the S&P 500 confirms this. Hence, most mutual fund companies are wasting their time (and their investors' money). However, when you get into active management the way WL Ross does it, the game changes. They have access to opportunities not available to a mutual fund because of their investment process, their investment opportunity set, their time horizon, and their access to deal flow. The stark contrast between Oppenheimer Funds and WL Ross made it very clear to me that one firm is positioned to take advantage of market inefficiencies, and the other, not so much.
Overall sentiment: trending towards bearish.
It was a rare treat to go down to the trading floor of the NYSE for the opening bell. Although the vast majority of trading has gone electronic, they still have specialists for many stocks that manually open and close the trading day. The specialist we talked to seemed to base trading decisions on split second gut reactions and news events - there was no time for any kind of fundamental analysis or even technical analysis (one screen had a chart on it, but he didn't seem to rely on it much). Interestingly, these market makers get paid by the exchange for providing liquidity. There were also mad swarms of people running around writing down the expected opening price from the specialists, which was then sent upstairs. There is an electronic feed that provides similar information, but apparently this manual one is more accurate (one of the advantages of having a seat on the exchange is that you can get better pre-market information). Sadly, I learned that the funny looking colored jackets used to be used to identify different positions on the floor, but have since been made unnecessary (though many still wear theirs).
The NYSE gave us a sales pitch on how companies list on their exchange because they want to co-brand themselves. I'm skeptical that this is a prominent consideration when a company lists itself today - the increases competition with Nasdaq over fees has certainly had an impact on the NYSE. In the next 10 years, it would not surprise me if the trading floor was gone all together. Or, the room will be filled with actors hired by CNBC so they can still claim to be reporting from the middle of the action - a live shot of a room full of servers is less glamorous, but more likely where the real trading action is taking place.
WL Ross
It's not everyday that you get to meet a legend in the industry, so we were understandably impressed by Wilbur Ross and one of his managers. These guys were sharp. It is not an exaggeration to claim that before they make an investment, they know more about the company than its own CFO. They have the patience to wait and not bid up deals when dumb money is rushing in. They are also prudent about leverage - if a deal needs a ton of leverage to work, then you're probably paying too much for it. If they think it's an attractive opportunity, they'll consider restructuring an entire industry (such as the entire US steel market). If I could invest with anyone we met this week, it would be this firm.
Oppenheimer Funds
A quantitative fund manager and his team spoke to us about their fund. They have a multi-factor model with almost 100 inputs. They do a lot of back testing. They revise their model periodically. Overall, they seemed like intelligent guys. You'd think that all this fancy math would remove human emotion and mistakes from the investment process - but all of this quantitative analysis eventually came down to which factors they thought would best predict future performance. Given that their fund has been lagging its benchmark, I find it hard to believe that these guys have any edge in factor selection (despite their overall level of intelligence and sophistication). They were unwilling to engage in a discussion of active versus passive management, although they did mention that one of their small cap funds had about 1200 holdings in it (that sounds a lot like a closet index fund, with a higher expense ratio). A cynical observer might note that active management fees do provide for well appointed office space.
The old debate about active versus passive management really fascinates me. Generally, I believe that the market for public equities in the US is pretty efficient. It is exceedingly difficult to earn abnormal risk-adjusted returns of any substantial magnitude over the long run. The statistics regarding active mutual funds that fail to outperform the S&P 500 confirms this. Hence, most mutual fund companies are wasting their time (and their investors' money). However, when you get into active management the way WL Ross does it, the game changes. They have access to opportunities not available to a mutual fund because of their investment process, their investment opportunity set, their time horizon, and their access to deal flow. The stark contrast between Oppenheimer Funds and WL Ross made it very clear to me that one firm is positioned to take advantage of market inefficiencies, and the other, not so much.
Overall sentiment: trending towards bearish.
Mar 10, 2009
A Week on Wall Street: Day 2
MSD Capital
Among other things, this group manages money for Michael Dell. They have recently started buying equities again. An observation: bank debt is trading like equity, equities are trading like options, and options are through the roof. Future inflation is an inevitability. We will not end up like Japan because the American consumer does not want to save - this is rooted in cultural differences. We'll be more like Hong Kong after the last crisis, although their nation is primarily based on pass-through transactions, so not sure how relevant the comparison is.
Primus Financial Products
This company pioneered credit default swaps that didn't require them to post any collateral based on changes in the underlying contract. Just as the monoline insurers have been hammered, so has Primus. Despite having several billion dollars of negative equity under GAAP, Primus is still alive, primarily because they did not have collateral requirements. In theory, as long as actual defaults stay low, most of these mark-to-market losses should reverse out as the contracts mature. Their portfolio of CDS is in run-off mode and they're trying to reinvent their business model. Our speaker was not very bullish on the concept of a CDS clearinghouse - but I believe it is only a matter of time before CDS companies are regulated as insurance companies (they are basically the same thing).
S&P, Structured Finance Ratings
Originally on the agenda, S&P's lawyers cancelled our meeting at the last minute since they are revamping the method they use to rate structured financial products. The phrase "a day late and a (billion) dollars short" comes to mind. I am amazed that the NRSROs have any credibility left at all.
Overall sentiment: slightly less bearish.
Among other things, this group manages money for Michael Dell. They have recently started buying equities again. An observation: bank debt is trading like equity, equities are trading like options, and options are through the roof. Future inflation is an inevitability. We will not end up like Japan because the American consumer does not want to save - this is rooted in cultural differences. We'll be more like Hong Kong after the last crisis, although their nation is primarily based on pass-through transactions, so not sure how relevant the comparison is.
Primus Financial Products
This company pioneered credit default swaps that didn't require them to post any collateral based on changes in the underlying contract. Just as the monoline insurers have been hammered, so has Primus. Despite having several billion dollars of negative equity under GAAP, Primus is still alive, primarily because they did not have collateral requirements. In theory, as long as actual defaults stay low, most of these mark-to-market losses should reverse out as the contracts mature. Their portfolio of CDS is in run-off mode and they're trying to reinvent their business model. Our speaker was not very bullish on the concept of a CDS clearinghouse - but I believe it is only a matter of time before CDS companies are regulated as insurance companies (they are basically the same thing).
S&P, Structured Finance Ratings
Originally on the agenda, S&P's lawyers cancelled our meeting at the last minute since they are revamping the method they use to rate structured financial products. The phrase "a day late and a (billion) dollars short" comes to mind. I am amazed that the NRSROs have any credibility left at all.
Overall sentiment: slightly less bearish.
Mar 9, 2009
A Week on Wall Street: Day 1
I had the privilege of joining a group of fellow finance MBAs last week for a trip to Wall Street. I don't know that there's ever been a better (worst?) time to visit Manhattan. Over the next five days I'll post my observations for each of our company visits. It was a great trip, and I really appreciated all of our speakers taking the time to meet with us. Disclaimer: These notes are my completely subjective recollection of the day's events and should not be interpreted as official statements by any of the organizations mentioned.
Wachtell, Lipton, Rosen & Katz
A partner from this law firm met with us and discussed the government's involvement in the financial markets beginning with the failure of Bear Stearns. His firm does a lot of work with M&A for financial services firms. A common theme throughout his remarks was that the government (i.e. the Fed and the Treasury Department) had forced many firms to accept a deals at the eleventh hour with verbal promises that they later reneged on. At the risk of sounding like a tinfoil hat enthusiast, it would not be an exaggeration to say "don't trust the government." As far as his investment outlook was concerned, he mentioned that he had moved his entire portfolio to cash and treasuries. On the plus side, this firm seems to have more work than it can handle (or at least, this practice area).
Deutsche Bank, Structured Products Group
This group creates options strategies to limit downside or lever upside. They'll either sell you the strategy and/or implement it for you, although I don't envy anyone trying to sell these products to retail investors (anything that sounds like "derivatives" is going to be anathema). If they put a package together for you, it will probably be with OTC options contracts, so be aware of the limited liquidity that accompanies such a program. I haven't heard of any bailouts for Deutsche Bank lately, but counterparty risk is also a concern for these one-off strategies.
Overall mood for day 1: moderately bearish.
Wachtell, Lipton, Rosen & Katz
A partner from this law firm met with us and discussed the government's involvement in the financial markets beginning with the failure of Bear Stearns. His firm does a lot of work with M&A for financial services firms. A common theme throughout his remarks was that the government (i.e. the Fed and the Treasury Department) had forced many firms to accept a deals at the eleventh hour with verbal promises that they later reneged on. At the risk of sounding like a tinfoil hat enthusiast, it would not be an exaggeration to say "don't trust the government." As far as his investment outlook was concerned, he mentioned that he had moved his entire portfolio to cash and treasuries. On the plus side, this firm seems to have more work than it can handle (or at least, this practice area).
Deutsche Bank, Structured Products Group
This group creates options strategies to limit downside or lever upside. They'll either sell you the strategy and/or implement it for you, although I don't envy anyone trying to sell these products to retail investors (anything that sounds like "derivatives" is going to be anathema). If they put a package together for you, it will probably be with OTC options contracts, so be aware of the limited liquidity that accompanies such a program. I haven't heard of any bailouts for Deutsche Bank lately, but counterparty risk is also a concern for these one-off strategies.
Overall mood for day 1: moderately bearish.
Mar 8, 2009
Why the stock market is close to the bottom
You know stocks are overbought when your hairdresser starts giving you investment advice. When everyone started talking about dot-com stocks in the early part of the decade, it was time to get out. When everyone was boasting about fat profits from flipping condos in Las Vegas, the bubble was obvious.
In the last few days, I've heard from several people, both sophisticated investors and 401k participants alike, talking about how much they hate equities. All of them have stopped making new contributions, and many have switched their portfolio entirely to cash and bonds over the last few months. People have started volunteering information about how much their portfolio lost before they capitulated. Not what you expect to hear from a complete stranger in the seat next to me on a recent flight.
I don't expect that things will turn around tomorrow, but if retail investor sentiment is any guide, 2009 will mark the low point in the market.
In the last few days, I've heard from several people, both sophisticated investors and 401k participants alike, talking about how much they hate equities. All of them have stopped making new contributions, and many have switched their portfolio entirely to cash and bonds over the last few months. People have started volunteering information about how much their portfolio lost before they capitulated. Not what you expect to hear from a complete stranger in the seat next to me on a recent flight.
I don't expect that things will turn around tomorrow, but if retail investor sentiment is any guide, 2009 will mark the low point in the market.
Mar 4, 2009
Mar 3, 2009
Federal Reserve: We don't mind traveling first-class
Recently, much attention has been paid to the travel destinations of banks and insurance companies. Call it the "AIG effect." CEOs were grilled over off-site meetings held at the beach or the casino that were supposedly financed with taxpayer dollars. Now the era of such extravagant travel has come to an end. Never mind the fact that hotels in Las Vegas and Hawaii are laying employees off because so many companies have cancelled their visits.
Surprisingly, the Federal Reserve didn't get the memo that these types of trips were no longer acceptable. Ben Bernanke is sponsoring and attending a posh off-site meeting in May, 2009 at Jekyll Island, Georgia to discuss financial crises and innovation. They are also footing the travel and lodging bills for many of the participants who work in the industry. No one can argue that this conference is extremely relevant, but why is the Fed hosting it at an island retreat? Is there really no cheaper option? The vast majority of attendees are probably coming from in New York and DC - was there no conference space available in either of these cities? Why can't the Fed's guests pay their own way?
The lesson: If a company wants to reward top perfoming employees with a trip to the beach, they should be drawn and quartered. But if the government wants to host a party for its friends, they just get out their checkbooks (and keep the party out of the media spotlight).
Surprisingly, the Federal Reserve didn't get the memo that these types of trips were no longer acceptable. Ben Bernanke is sponsoring and attending a posh off-site meeting in May, 2009 at Jekyll Island, Georgia to discuss financial crises and innovation. They are also footing the travel and lodging bills for many of the participants who work in the industry. No one can argue that this conference is extremely relevant, but why is the Fed hosting it at an island retreat? Is there really no cheaper option? The vast majority of attendees are probably coming from in New York and DC - was there no conference space available in either of these cities? Why can't the Fed's guests pay their own way?
The lesson: If a company wants to reward top perfoming employees with a trip to the beach, they should be drawn and quartered. But if the government wants to host a party for its friends, they just get out their checkbooks (and keep the party out of the media spotlight).
Mar 2, 2009
S&P 500 Earnings for 4Q 2008
S&P publishes an excel file with total earnings per share for all the companies in the index. Currently, 93% of companies have reported their 4Q 2008 numbers, and the total EPS for the index is: -$11.97. That is to say, if you added up the earnings of every company in the index, there were enough losers to counteract the winners and the group lost money as a whole. Earnings for the year will be $39.73. However, the Wall Street Journal claims this is misleading. Although the index itself is market-cap weighted (larger firms have more impact on the index), the published EPS is equally weighted across all firms. S&P takes earnings from every firm and adds them up, so a dollar of EPS from Abbot Labs counts as much as a dollar from Zimmer Holdings. The Journal argues that since an investor doesn't hold every stock in the index in equal amounts, each firm's EPS should be weighted by its proportion in the index. If you adjust 2008 earnings this way, you arrive at $71.10 for the year. If you are trying to determine if the market is over- or under-valued based on a P/E ratio, it makes a big difference if you use $39 or $71 for the E.
I think both methods are useful. Consider the following scenario with only two stocks in the index:

S&P's method of calculating aggregate EPS is informative for the health and total earnings of the entire index, or economy as a whole. The Journal's method of weighted earnings is useful for an investor who wholds the index, since it better represents his share of earnings based on his proportional ownership in the companies.
I think both methods are useful. Consider the following scenario with only two stocks in the index:

S&P's method of calculating aggregate EPS is informative for the health and total earnings of the entire index, or economy as a whole. The Journal's method of weighted earnings is useful for an investor who wholds the index, since it better represents his share of earnings based on his proportional ownership in the companies.
Feb 27, 2009
Borrow your way to prosperity
Here's a cheerful graph from the asset managers at Hoisington, showing the total U.S. debt (government, consumer, and industry) as a percentage of GDP:

If you read the entire report, Hoisington makes Jeremy Grantham look bullish by comparison. Crazy bear market theorists are in fashion right now, but before you write these guys off, consider that their fund returned +37% in 2008 and +13% over the last 5 years. They bet big on long-term, zero coupon treasuries and it paid off.
Their big concern is debt deflation: assets are purchased using large amounts of debt during an economic over-expansion, but then fall in value when things slow down and are unable to generate enough income to make the debt service payments. The bank can no longer sell the asset for enough to cover the debt, leading to large writeoffs.

If you read the entire report, Hoisington makes Jeremy Grantham look bullish by comparison. Crazy bear market theorists are in fashion right now, but before you write these guys off, consider that their fund returned +37% in 2008 and +13% over the last 5 years. They bet big on long-term, zero coupon treasuries and it paid off.
Their big concern is debt deflation: assets are purchased using large amounts of debt during an economic over-expansion, but then fall in value when things slow down and are unable to generate enough income to make the debt service payments. The bank can no longer sell the asset for enough to cover the debt, leading to large writeoffs.
Feb 26, 2009
The true risk of stocks for the long run (part 4)
If you believe these arguments, how does one create an actionable investment strategy? The first step is often overlooked: consider if you should be investing at all. Individuals need to reassess the wisdom of carrying debt while simultaneously investing in stocks. This approach creates implicit leverage in your investment strategy, which will magnify the gains as well as the losses. It is one thing for corporations and hedge funds to employ leverage, but I do not think such a strategy is appropriate for most households. If you have car loans, credit card debt, or even some student loans at a high rate of interest, they should always be paid off before you start investing.
The mortgage payoff question is less clear cut. The expected return from paying off your mortgage may be lower than investing in stocks, but the mortgage is a risk-free investment. Consider: if it were a no-brainer to take a large mortgage and invest the money in the stock market, why would banks even bother writing mortgages? They could be much more profitable by just investing those funds directly in stocks. The interest tax deduction is frequently evangelized, but the true value of it actually depends on your marginal tax rate as well as the size of the standard deduction versus your itemized deductions. Even if you do get a deduction for it, does it make sense to pay $1.00 in interest to save $0.25 in taxes? You’d still be better off it you had never spent the $0.75 in the first place. It is also worth considering that if you have $100,000 and you give it to your financial adviser to invest, he will earn an annual fee on those funds. If you use it to pay down your mortgage, your financial adviser receives no commission. So what course of action are most advisers going to recommend?
On the other hand, it probably makes sense to prioritize tax-advantaged accounts like the Roth IRA ahead of the mortgage paydown, since there is a limited window for contributions to a Roth IRA (each tax year forces you to “use it or lose it” as there are no retroactive contributions). Similarly, 401k contributions necessary to receive your employer’s matching funds should also take priority over mortgage elimination. But blithely putting as much as you possibly can in a 401k or IRA just because it has some tax advantages is sub-optimal for most investors.
Once the decision to invest has been made, the percentage in stocks and bonds must be determined. Unfortunately, I don’t have a grand unified theory of asset allocation. The best starting point is using traditional mean-variance optimization from modern portfolio theory to create the efficient portfolio. The output would look something like this (the actual output would differ from this graph because I would include asset returns and correlations prior to 1970 up through the present day):

My point here is not that the traditional approach to portfolio construction is flawed; the output (the graph) is reasonable, but the interpretation of the results leads investors astray. This graph tends to make people think that a higher percentage investment in stocks guarantees them a higher return over the long run. A fancy graph makes anything more believable due to the “quantification of fantasy” principle. So investors pick a risky asset allocation that is on the right side of the curve, because that is where you get the highest expected return for each unit of risk (approximately 80% stocks, 20% bonds). However, I believe that for the vast majority of individual investors – those who are financially unsophisticated and saving towards retirement or other long-term goals – the optimal portfolio favors minimizing variance rather than maximizing return/risk. That occurs at the left-most point on the graph - 25% stocks, 75% bonds.
Therefore, the appropriate mix of stocks versus bonds would almost certainly lower than the "bond allocation equals your age" rule of thumb that many use (i.e. if you are 25 years old, you should hold 25% of your assets in bonds). For someone nearing retirement, it is probably lower than the 53% allocated to stocks by Vanguard's Target Retirement 2010 fund. For a young person in their 20's or 30's, it is probably much less than the 90% allocated to stocks by Vanguard's Target Retirement 2050 fund. A very rough estimate of my generally recommended portfolio would invest one-third of its value in each of the following asset classes:
The mortgage payoff question is less clear cut. The expected return from paying off your mortgage may be lower than investing in stocks, but the mortgage is a risk-free investment. Consider: if it were a no-brainer to take a large mortgage and invest the money in the stock market, why would banks even bother writing mortgages? They could be much more profitable by just investing those funds directly in stocks. The interest tax deduction is frequently evangelized, but the true value of it actually depends on your marginal tax rate as well as the size of the standard deduction versus your itemized deductions. Even if you do get a deduction for it, does it make sense to pay $1.00 in interest to save $0.25 in taxes? You’d still be better off it you had never spent the $0.75 in the first place. It is also worth considering that if you have $100,000 and you give it to your financial adviser to invest, he will earn an annual fee on those funds. If you use it to pay down your mortgage, your financial adviser receives no commission. So what course of action are most advisers going to recommend?
On the other hand, it probably makes sense to prioritize tax-advantaged accounts like the Roth IRA ahead of the mortgage paydown, since there is a limited window for contributions to a Roth IRA (each tax year forces you to “use it or lose it” as there are no retroactive contributions). Similarly, 401k contributions necessary to receive your employer’s matching funds should also take priority over mortgage elimination. But blithely putting as much as you possibly can in a 401k or IRA just because it has some tax advantages is sub-optimal for most investors.
Once the decision to invest has been made, the percentage in stocks and bonds must be determined. Unfortunately, I don’t have a grand unified theory of asset allocation. The best starting point is using traditional mean-variance optimization from modern portfolio theory to create the efficient portfolio. The output would look something like this (the actual output would differ from this graph because I would include asset returns and correlations prior to 1970 up through the present day):

My point here is not that the traditional approach to portfolio construction is flawed; the output (the graph) is reasonable, but the interpretation of the results leads investors astray. This graph tends to make people think that a higher percentage investment in stocks guarantees them a higher return over the long run. A fancy graph makes anything more believable due to the “quantification of fantasy” principle. So investors pick a risky asset allocation that is on the right side of the curve, because that is where you get the highest expected return for each unit of risk (approximately 80% stocks, 20% bonds). However, I believe that for the vast majority of individual investors – those who are financially unsophisticated and saving towards retirement or other long-term goals – the optimal portfolio favors minimizing variance rather than maximizing return/risk. That occurs at the left-most point on the graph - 25% stocks, 75% bonds.
Therefore, the appropriate mix of stocks versus bonds would almost certainly lower than the "bond allocation equals your age" rule of thumb that many use (i.e. if you are 25 years old, you should hold 25% of your assets in bonds). For someone nearing retirement, it is probably lower than the 53% allocated to stocks by Vanguard's Target Retirement 2010 fund. For a young person in their 20's or 30's, it is probably much less than the 90% allocated to stocks by Vanguard's Target Retirement 2050 fund. A very rough estimate of my generally recommended portfolio would invest one-third of its value in each of the following asset classes:
- Equities, distributed between US, developed, and emerging markets
- Inflation protected securities, such as TIPS
- Other bonds like treasuries, corporate, and high-yield
This would be a time-independent allocation that would remain fixed throughout someone's accumulation phase, with a possible reduction in the equity exposure to 20% once the investor enters retirement. Annual rebalancing is assumed and the individual asset classes would be held in index mutual funds with low-cost, passive management.
Some will object to such a low allocation to equities (33%). They will say that over the long term, inflation will destroy the purchasing power of your portfolio. Personally, I think inflation has been used to scare many investors into holding more stocks than they should. If you look at equity returns from the 1970s when the US had high inflation, stocks held up better than bonds but I would hardly call them a good investment over the period. Nonetheless, inflation risk is a legitimate concern, and that is addressed by the 33% allocation to Treasury Inflation Protected Securities (TIPS). These are bonds issued by the US government that increase in value with inflation. Most investors are unfamiliar with them because the government doesn’t run TV commercials telling you to buy them and financial advisers have little incentive to push them due to their lower expected returns. However, they can help protect you from unexpected inflation and are as safe as any government bond (they have no credit risk). You can buy them directly from the Treasury for free, or you can purchase a mutual fund or ETF that manages them for you for a small fee. Because they are bonds, TIPS are best held in a tax-advantaged account like a 401k or IRA.
When times are good and stocks are posting double digit returns, no one feels the need to question how returns are being generated (see: Madoff, Stanford, et al). Investors’ skepticism goes out the window because they think there is easy money to be made. We are all prone to recency bias, believing that the future will look like the not-too-distant past. It is only when risk comes to the forefront that investors reevaluate their exposure to unfavorable outcomes. They realize that risk is not just a number on a page like standard deviation, it is a significant loss of wealth that can affect your quality of life. This also means that investors need to be extremely skeptical of anyone proposing a radical change in investment philosophy – acting out of fear is no better than acting out of greed. If the market drops 50% and you sell all your stocks, what will you do when it starts to recover? I believe it is far better to adopt a reasonable, consistent plan of saving and investing that allows some upside but more importantly, protects you from the disastrous downside. The ideas in this paper are not new; many of them are condensed from arguments made by Paul Samuelson and Zvi Bodie, among others. I appreciate their efforts in challenging the conventional wisdom.
Feb 25, 2009
The true risk of stocks for the long run (part 3)
If investors have been systematically underestimating the risk of holding stocks, where did this bias come from? The financial services industry deserves some of the blame, as do individual investors.
Financial advisers are compensated based on their ability to get clients to invest primarily in equity funds instead of bond funds because higher management fees can be earned on equity funds. It is a lot easier to collect a 2% expense ratio from a stock fund earning 12% than a bond fund earning 5%. There is also a herd mentality - if you put your clients in safe but low return investments, when they hear about their neighbor's awesome returns for 2 or 3 years in a row, you are likely to be out of a job. So advisers try to stay close to the benchmark of what everyone else is doing and speak of performance in relative terms, "we outperformed the S&P 500 by 5% last year." But if the S&P lost 40%, you still lost 35%. As the saying goes, “you can’t eat relative returns,” meaning that if you depend on your portfolio for living expenses, a 35% loss may drastically reduce your standard of living. Another common fallacy: many people think that after a 35% loss, a 35% gain will get them back to break-even. In reality, you need a 54% gain the subsequent year just to break even (and if there was inflation, you still lost ground). We must pay more attention to absolute returns and capital preservation along with growth and inflation protection.
Investors are also guilty of focusing on returns rather than risk. With higher expected returns, they can afford to save less and spend more today. If you assume your investments will earn 12% compounded over the next 30 years (illustrated graphically in almost every investment advisor proposal), you hardly need to save anything at all for retirement. This fallacy was believable not only because we heard it from the "experts" but because we wanted to believe it. It is much easier to increase your 401k’s allocation to equities than to save an additional 10% of your income. I’ve heard from people close to retirement who realize they cannot save enough to afford the lifestyle they expect – so they increase their equity allocation in the hopes of doubling down and winning big. People in that situation should be taking less risk, not more. Stock returns in the 1980s and 1990s made it even easier to believe that stocks would always bounce back. Unfortunately, the power of leverage and cheap credit to inflate those returns is only now fully understood.
The bottom line: asset allocation is the single most important factor in investment returns. But investment returns are only a means to achieve an even more important objective: a comfortable retirement (or college savings, or whatever your goal may be). The most certain way to achieve your long-term financial goals comes not from investing a high percentage of your net worth in stocks, but in saving a higher percentage of your after-tax income and reducing household debt. Stocks are unquestionably an important part of any portfolio. I do not deny the benefits of diversification and its ability to improve the risk-return tradeoff. But stocks are not a low risk investment, no matter how long you hold them. They are also not a silver bullet that will allow you to save 3% of your income and guarantee a comfortable retirement just because you put 90% of your IRA in equities. “Saving” should be risk free, and “investing” should be risky. Somewhere along the way we confused the two terms.
Financial advisers are compensated based on their ability to get clients to invest primarily in equity funds instead of bond funds because higher management fees can be earned on equity funds. It is a lot easier to collect a 2% expense ratio from a stock fund earning 12% than a bond fund earning 5%. There is also a herd mentality - if you put your clients in safe but low return investments, when they hear about their neighbor's awesome returns for 2 or 3 years in a row, you are likely to be out of a job. So advisers try to stay close to the benchmark of what everyone else is doing and speak of performance in relative terms, "we outperformed the S&P 500 by 5% last year." But if the S&P lost 40%, you still lost 35%. As the saying goes, “you can’t eat relative returns,” meaning that if you depend on your portfolio for living expenses, a 35% loss may drastically reduce your standard of living. Another common fallacy: many people think that after a 35% loss, a 35% gain will get them back to break-even. In reality, you need a 54% gain the subsequent year just to break even (and if there was inflation, you still lost ground). We must pay more attention to absolute returns and capital preservation along with growth and inflation protection.
Investors are also guilty of focusing on returns rather than risk. With higher expected returns, they can afford to save less and spend more today. If you assume your investments will earn 12% compounded over the next 30 years (illustrated graphically in almost every investment advisor proposal), you hardly need to save anything at all for retirement. This fallacy was believable not only because we heard it from the "experts" but because we wanted to believe it. It is much easier to increase your 401k’s allocation to equities than to save an additional 10% of your income. I’ve heard from people close to retirement who realize they cannot save enough to afford the lifestyle they expect – so they increase their equity allocation in the hopes of doubling down and winning big. People in that situation should be taking less risk, not more. Stock returns in the 1980s and 1990s made it even easier to believe that stocks would always bounce back. Unfortunately, the power of leverage and cheap credit to inflate those returns is only now fully understood.
The bottom line: asset allocation is the single most important factor in investment returns. But investment returns are only a means to achieve an even more important objective: a comfortable retirement (or college savings, or whatever your goal may be). The most certain way to achieve your long-term financial goals comes not from investing a high percentage of your net worth in stocks, but in saving a higher percentage of your after-tax income and reducing household debt. Stocks are unquestionably an important part of any portfolio. I do not deny the benefits of diversification and its ability to improve the risk-return tradeoff. But stocks are not a low risk investment, no matter how long you hold them. They are also not a silver bullet that will allow you to save 3% of your income and guarantee a comfortable retirement just because you put 90% of your IRA in equities. “Saving” should be risk free, and “investing” should be risky. Somewhere along the way we confused the two terms.
Feb 24, 2009
The true risk of stocks for the long run (part 2)
This simple model posits that investing in stocks for 30 years is actually more risky than investing in them for only 1 year. This runs counter to most of the standard advice about investing. Yet you can clearly see that the risk of investing in stocks increases with time by looking at the price of insuring your portfolio against losses buy buying put options on the S&P 500 index. The graph below shows the how the cost of such insurance as a percentage of your portfolio increases as you increase the length of time you want protection. But are there other reasons why stocks really are a better investment for the long run?

My coin flipping model assumes that returns follow a binomial distribution. For this to be true, equity returns must follow a random walk. Although I believe they do but this is open to debate. There is some evidence that returns are not random from year to year, but are actually mean-reverting. This occurs when a stochastic process tends to return to its long-term average value. To put it another way – if stocks drop a lot over several years, eventually prices will be so low that investors start buying, and returns move back to the average. It’s a plausible theory, but the mean reversion effect is weak. You can’t earn abnormal profits by buying after the market drops one year or sell short after it rises the following year. For example, after the market has a bad (good) year, it may continue to drop (rise) for the next several years. Even if we accept mean reversion, it may take so long for returns to get back to the average that an investor can’t rely on them to prevent his portfolio from declining over a 10 or 20 year period. If those 20 years occur near your retirement, there may not be time to recover before you are forced to start drawing down your principal.
Another line of reasoning says that an investor has two types of assets in his portfolio: financial capital and human capital. Early in your career, you have a lot of human capital and little financial capital. Over time, you convert your human capital into financial capital through savings. Returns to human capital are considered risk-free. Since the intelligent investor should consider the risk of all assets in his portfolio, young people with a lot of riskless human capital can afford to take more risk with their financial capital, and shift this mix over time. My problem with this argument is that your human capital should not be viewed as a risk-free asset. Skills and education are valuable but not invulnerable from risks such as technological change or substitution by cheaper labor somewhere else in the world. Moreover, your returns to human capital are not completely independent from the overall economy. Unemployment and declines in equity prices are highly correlated, so at the time you are most likely to lose your job (or at the very least, not receive a raise or promotion), stocks are also likely to be down. A counter argument to my proposal says that if stocks prices go down, you can work more years to replenish your portfolio. However, there are many other risks to your human capital such as illness, injury, or family circumstances that could force you to leave the labor force early. I believe that economic security in retirement is just too important to assume that none of these risks will affect you.

My coin flipping model assumes that returns follow a binomial distribution. For this to be true, equity returns must follow a random walk. Although I believe they do but this is open to debate. There is some evidence that returns are not random from year to year, but are actually mean-reverting. This occurs when a stochastic process tends to return to its long-term average value. To put it another way – if stocks drop a lot over several years, eventually prices will be so low that investors start buying, and returns move back to the average. It’s a plausible theory, but the mean reversion effect is weak. You can’t earn abnormal profits by buying after the market drops one year or sell short after it rises the following year. For example, after the market has a bad (good) year, it may continue to drop (rise) for the next several years. Even if we accept mean reversion, it may take so long for returns to get back to the average that an investor can’t rely on them to prevent his portfolio from declining over a 10 or 20 year period. If those 20 years occur near your retirement, there may not be time to recover before you are forced to start drawing down your principal.
Another line of reasoning says that an investor has two types of assets in his portfolio: financial capital and human capital. Early in your career, you have a lot of human capital and little financial capital. Over time, you convert your human capital into financial capital through savings. Returns to human capital are considered risk-free. Since the intelligent investor should consider the risk of all assets in his portfolio, young people with a lot of riskless human capital can afford to take more risk with their financial capital, and shift this mix over time. My problem with this argument is that your human capital should not be viewed as a risk-free asset. Skills and education are valuable but not invulnerable from risks such as technological change or substitution by cheaper labor somewhere else in the world. Moreover, your returns to human capital are not completely independent from the overall economy. Unemployment and declines in equity prices are highly correlated, so at the time you are most likely to lose your job (or at the very least, not receive a raise or promotion), stocks are also likely to be down. A counter argument to my proposal says that if stocks prices go down, you can work more years to replenish your portfolio. However, there are many other risks to your human capital such as illness, injury, or family circumstances that could force you to leave the labor force early. I believe that economic security in retirement is just too important to assume that none of these risks will affect you.
Feb 23, 2009
The true risk of stocks for the long run (part 1)
Are retail investors taking more risk than they realize? The following discussion is directed towards individual investors who are saving for long term goals such as retirement, primarily using a buy-and-hold approach in accounts like a 401k. The conventional wisdom says that the more time until you need your principal, the more risk you can afford to take, and therefore you should invest more in stocks. What is the logic behind this? Let’s say someone offers you a $100 “investment” based on a coin flip. Heads, you earn 33%, tails, you lose 25%. So after one flip you’ll either have $133 or $75. Since each outcome is equally likely (50/50), on average your $100 investment will return $104, or 4%. That’s not too bad. Let’s imagine that each coin-flip in this example is equal to one year of investing in the stock market. Here’s what a simple payoff tree looks like:

However, you can make this investment multiple times. Every time you flip the coin, there is still a 50/50 chance of heads/tails, and the payoffs remain the same. Since the coin is random, you figure that the more times you flip it, the more likely it is that the total number of heads versus tails will even out. This is equivalent to investing over multiple years. Your financial adviser confirms your intuition and tells you that historically, the variation of stock market returns decreases as you invest over longer period of times. It’s a reasonable-sounding (but flawed) assumption that the more times you flip, the less likely you are to get a bunch of heads or tails in a row. But you believe what your financial adviser tells you, so you expect the risk of this investment to go down if you’re willing to flip it four times instead of just once. Here’s what the payoff tree looks like now:

The average ending portfolio value (probability weighted average) is now $117, which is your 4% expected return compounded 4 times. However, something strange has happened with the ending values. The dispersion between the best and worst cases has increased, from $313 to $31. You also notice that there’s a 70% chance (6% + 25% + 38%) you don’t do any better than break even, and a 31% chance (6% + 25%) that your $100 investment is worth $56 or less after 4 flips. If this money was needed to support you in retirement, would you consider these to be good odds? Is your coin-flip investment (stocks) really better than a less risky alternative investment that might guarantee you an ending value of $106 over four years but with no downside risk? This graph from the Wall Street Journal shows that anyone who started investing after 1996 would’ve been better off in a no-risk money market account than in a broad market index:

Consider the coin flip investment similar to investing in stocks. As you increase the number of investment periods above 4, the trends illustrated in this overly simplified example only continue to increase. The best case gets much better, and the worst case gets much worse. The risk of a substantial shortfall increases as you flip the coin more times. This is contrary to the traditional wisdom that a longer investment horizon reduces the risk of volatile assets. I’ve written about the myth of time diversification before, but this example clearly illustrates how the risk to your portfolio’s final value increases, rather than decreases, over time. At the end of the day, the final value is what matters – standard deviation and expected returns are great, but you can’t eat them.
My point is not that investors should avoid stocks entirely, but that they should be aware of the fact that investing for the long term does not eliminate the risk of stocks. Riskier assets have a higher expected return, but not necessarily a higher realized return. You are not guaranteed a higher return just because you took more risk. If investors are going to be compensated for taking risk, then there has to be a real risk of loss over the long term or else why would the risk premium exist? If you still don’t believe me, take a look at a graph of the Nikkei over the last 25 years:
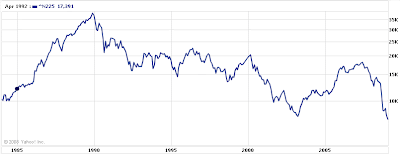
If you think I’m being overly pessimistic, or if you think the Japanese economy is sufficiently different from the US economy, then how about the returns on the S&P 500 from 1966-1982?


However, you can make this investment multiple times. Every time you flip the coin, there is still a 50/50 chance of heads/tails, and the payoffs remain the same. Since the coin is random, you figure that the more times you flip it, the more likely it is that the total number of heads versus tails will even out. This is equivalent to investing over multiple years. Your financial adviser confirms your intuition and tells you that historically, the variation of stock market returns decreases as you invest over longer period of times. It’s a reasonable-sounding (but flawed) assumption that the more times you flip, the less likely you are to get a bunch of heads or tails in a row. But you believe what your financial adviser tells you, so you expect the risk of this investment to go down if you’re willing to flip it four times instead of just once. Here’s what the payoff tree looks like now:

The average ending portfolio value (probability weighted average) is now $117, which is your 4% expected return compounded 4 times. However, something strange has happened with the ending values. The dispersion between the best and worst cases has increased, from $313 to $31. You also notice that there’s a 70% chance (6% + 25% + 38%) you don’t do any better than break even, and a 31% chance (6% + 25%) that your $100 investment is worth $56 or less after 4 flips. If this money was needed to support you in retirement, would you consider these to be good odds? Is your coin-flip investment (stocks) really better than a less risky alternative investment that might guarantee you an ending value of $106 over four years but with no downside risk? This graph from the Wall Street Journal shows that anyone who started investing after 1996 would’ve been better off in a no-risk money market account than in a broad market index:

Consider the coin flip investment similar to investing in stocks. As you increase the number of investment periods above 4, the trends illustrated in this overly simplified example only continue to increase. The best case gets much better, and the worst case gets much worse. The risk of a substantial shortfall increases as you flip the coin more times. This is contrary to the traditional wisdom that a longer investment horizon reduces the risk of volatile assets. I’ve written about the myth of time diversification before, but this example clearly illustrates how the risk to your portfolio’s final value increases, rather than decreases, over time. At the end of the day, the final value is what matters – standard deviation and expected returns are great, but you can’t eat them.
My point is not that investors should avoid stocks entirely, but that they should be aware of the fact that investing for the long term does not eliminate the risk of stocks. Riskier assets have a higher expected return, but not necessarily a higher realized return. You are not guaranteed a higher return just because you took more risk. If investors are going to be compensated for taking risk, then there has to be a real risk of loss over the long term or else why would the risk premium exist? If you still don’t believe me, take a look at a graph of the Nikkei over the last 25 years:

If you think I’m being overly pessimistic, or if you think the Japanese economy is sufficiently different from the US economy, then how about the returns on the S&P 500 from 1966-1982?

Feb 22, 2009
Pension funds and financial economics
Pension funds are experiencing a double-whammy: losses at a time when companies can least afford to fund them. This highlights the advantages of a pension asset allocation devoted entirely to fixed income. This financial economics approach does a better job of matching the duration of a pension's assets with its liabilities. Stockholders would no longer require a risk premium for the company's pension assets, decreasing the firm's cost of capital. Consequently, enterprise value would be higher and hurdle rates for capital budgeting decisions would be lower, encouraging investment and job creation. Finally, better tax efficiency can be achieved by using scarce tax-advantaged accounts to hold income generating bonds rather than equities, which are already tax efficient.
Unfortunately, misaligned incentives in the current pension regime make this change unlikely. Would any rational person claim that a dollar of stocks is worth more than a dollar of bonds? Oddly, this is the fundamental assumption of current pension accounting rules. Corporations can reduce their funding requirements by holding more equities since the expected return is higher. However, this fails to account for the added risk borne by employees (and taxpayers, via the PBGC), who are the beneficiaries of the plan. Under these rules, corporate managers are divided between doing what is best for short-term investors versus what is in the interests of long-term employees.
Unfortunately, misaligned incentives in the current pension regime make this change unlikely. Would any rational person claim that a dollar of stocks is worth more than a dollar of bonds? Oddly, this is the fundamental assumption of current pension accounting rules. Corporations can reduce their funding requirements by holding more equities since the expected return is higher. However, this fails to account for the added risk borne by employees (and taxpayers, via the PBGC), who are the beneficiaries of the plan. Under these rules, corporate managers are divided between doing what is best for short-term investors versus what is in the interests of long-term employees.
Feb 21, 2009
Internal rate of return versus time-weighted return
IRR is primarily used by investors in private, non-marketable securities while TWR is more appropriate for mutual funds that invest in liquid, public securities. Since mutual fund managers can't control the timing of cash inflows and outflows, TWR presents a more accurate view of realized returns. IRR considers the timing and magnitude of cash flows, which private equity managers have control over. More details here.
Feb 20, 2009
A bender to remember
When the price of something goes down, consumption tends to increase (all other things being equal). So what do we make of this graph from the Wall Street Journal's article on The Great Interest Rate Wave? The cost of borrowing money decreased over the last 30 years, so everyone loaded up on it. If this trend reverses, it will not be a pretty picture for investors.


Feb 19, 2009
The aftermath of financial crises
That's the title of a recent paper from the National Bureau of Economic Research. The news is not good. The authors excluded emerging markets crises from the first draft of the paper because they thought those results were too dour. Now, it no longer seems like hyperbole to include them. Here's a summary of their findings:

- On average, house prices decline 35% over 6 years
- Unemployment rises 7%
- Equity prices drop 55% over 3 years
By the second measure, we're ahead of schedule (let's hear it for the USA!). Oh, and there's an 86% increase in government debt. Good thing we balanced our budget before this mess came along. Oh wait, we've been running deficits for years? That can't be good.
They base their analysis on the "big five" crises in post-war developed markets: Spain 1977, Norway 1987, Finland, 1991, Sweden, 1991, and Japan, 1992. For good measure they include the 1997 Asian financial crisis, Columbia 1998, and Argentina 2001. Output (GDP) declines 9% from peak to trough but recovers in only 2 years, and none of the crises studied were nearly as bad as the great depression. However, previous problems were national or regional in nature. It is still unclear how the global nature of this disaster will affect the severity and time to recovery.

Feb 18, 2009

Feb 17, 2009
The 2008 Periodic Table of Investments
2008 may be a year that most investors would like to forget, but Callan has decided to go ahead and publish their periodic table of investment returns anyway, available here. Unquestionably, this is the worst year in the 20 years of returns shown on the chart. The best asset class, Barclay's aggregate bond index, had a lower return than any other top asset class over the years. This used to be the Lehman bond index, but they shuffled off this mortal coil. 2008's third place winner, the Russell 2000 (-33.79%), performed worse than the worst asset class in every other year.
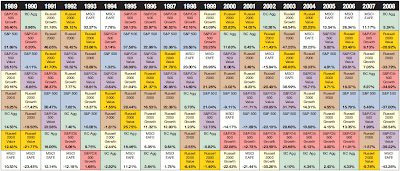

Feb 16, 2009
Google Trends Revisited
I wrote about Google Trends before but didn't really explore the graphical option (you can also export results to Excel and manipulate the data as you see fit). A few interesting observations. Curiosity about "deflation" started to pick up at the end of last year, versus inflation which spiked earlier in the year as oil hit $147/barrel.

Searches for "cheap wedding" have been steadily increasing over the last five years, especially in 2008. Note the steady decline through the fall and spike at year end. Must be Christmas/New Years engagement surprises?

If the graph below is correct, 2008 may be the year that pawn shops replaced investment banks as sources of capital. I-banks rallied right around the time Lehman collapsed, but then continued trending down. The second image shows a geographic look at the search terms' support: Miami and Las Vegas were both bullish on pawn shops. Coincidence that these cities also have some of the most rapidly falling home values in the country.


Many terms seem to show a cyclical decrease in activity over the summer. Is this due to students being out of school and googling less?
Searches for "cheap wedding" have been steadily increasing over the last five years, especially in 2008. Note the steady decline through the fall and spike at year end. Must be Christmas/New Years engagement surprises?
If the graph below is correct, 2008 may be the year that pawn shops replaced investment banks as sources of capital. I-banks rallied right around the time Lehman collapsed, but then continued trending down. The second image shows a geographic look at the search terms' support: Miami and Las Vegas were both bullish on pawn shops. Coincidence that these cities also have some of the most rapidly falling home values in the country.
Many terms seem to show a cyclical decrease in activity over the summer. Is this due to students being out of school and googling less?
Feb 9, 2009
The Feng Shui Index
Tired of relying on fundamental analysis to figure out where the markets are going? Technical analysis isn't any better. Thankfully, an Asian investment bank, CLSA, has released their Feng Shui Index for 2009. You can download a copy here. Take note that it is based on "not much more than wind, water, a bunch of fanciful farmyard animals and frequent recourse to spirits." Although this is technically the year of the ox, they predict it will be more of a cow.
Feb 8, 2009
Endowment performance in 2008
NACUBO is the National Association of College and Business Officers. They report statistics on endowment size, performance, and asset allocation. Their 2008 endowment studies are available here and overall, they reported an annual return of -3% for 2008. However, the fiscal year for this report runs through June, not December. They also reported a further 23% decline for the first five months of the 2009 fiscal year - from July through November. Things will probably look even worse once December and January's results are included. It is striking to think that professionally managed, highly diversified portfolios, many over a billion dollars, can take such a substantial hit when the market heads down.
They also report on asset allocation by endowment size. Not surprisingly, larger endowments have greater allocations to alternative asset classes such as private equity, hedge funds, and natural resources. It will be interesting to see when the FY09 results are published if this helped or hurt the larger endowments. The average spending rate (the funds that go to support the university's operations) averaged 4.6%. If returns don't improve, I expect this will also decline in 2009, creating a budget shortfall that will leave many universities (and eventually, students) in a tough spot.
They also report on asset allocation by endowment size. Not surprisingly, larger endowments have greater allocations to alternative asset classes such as private equity, hedge funds, and natural resources. It will be interesting to see when the FY09 results are published if this helped or hurt the larger endowments. The average spending rate (the funds that go to support the university's operations) averaged 4.6%. If returns don't improve, I expect this will also decline in 2009, creating a budget shortfall that will leave many universities (and eventually, students) in a tough spot.
Jan 31, 2009
Is your city becoming a hard-money lender?
The Wall Street Journal reported this week that some cities in California are providing subsidized loans to struggling auto dealerships. Even if you believe it is the government's job to finance private enterprise, this is a terrible way to do it. Why is this such a bad idea?
- Municipal bondholders will be forced to take on more risk than they were expecting, pushing prices down and yields up. This will increase the city's cost of borrowing. Higher interest expense means higher taxes or a reduction in city services.
- Rather than diversifying its risk, the city has concentrated it even further. Since it depends on tax revenues to operate, if businesses fail then taxes will decline. After making a loan to a struggling business, it's in even more trouble if things go bad - it will lose both the tax revenue as well as the principal on the loan. So the risk of financial distress for the city has increased (is this really a good time to be taking on more risk?).
- The city is essentially engaging in interest rate arbitrage - using its strong credit rating to borrow cheap (plus taking advantage of the federal tax exemption) while lending to extremely risky businesses at below-market rates. If you found out that your city was using tax revenues to buy junk bonds, would you approve of that? This is no different. Actually, this is worse, because at least junk bonds might be fairly priced - the loans in this article are at below market rates, so the "investors" (the city's taxpayers) are not even getting a fair risk/return trade off.
- The city doesn't have the resources to properly underwrite, monitor, or enforce collections the loans like a normal bank. A bank has departments that deal with all of these issues and as a result, can provide those services at a lower cost than a city that has to develop them from the ground up.
- When things go bad, the city will face a lot of pressure to avoid calling the loan and foreclosing on the business. It creates a rat's nest of tangled political issues that will result in poor economic decisions being made.
- It encourages a "race to the bottom" among cities to offer lower tax rates to prop up uneconomical or inefficient businesses while forcing the tax burden on the successful ones.
Jan 24, 2009
S&P 500 returns and the normal distribution
One of the fundamental assumptions in modern finance's asset pricing models is that returns follow a normal (Gaussian) distribution. The histogram below shows the annual percentage returns on the S&P 500 from 1926-2008, grouped by 5% increments, overlaid with the normal distribution curve. Note the fat tail on the left that includes the two worst years, 1931 and 1937.
Until last year, many assumed that these data points could be ignored because "things were different" after WWII, so they proceeded to fill their VaR models with mean returns and standard deviations calculated post-1945. My finance textbook, published in 2006, discusses the differences between 40-year returns and 80-year returns and decides that the 40-year returns, (which exclude the 1930s) are more appropriate for our purposes. The book states that "it appears that observed fat tails are largely due to older history" and "we have more confidence that the more recent averages better estimate expected returns for the near future." Then 2008 dropped a -37% return on us. It will be interesting to see how they address this issue in the next edition.

Until last year, many assumed that these data points could be ignored because "things were different" after WWII, so they proceeded to fill their VaR models with mean returns and standard deviations calculated post-1945. My finance textbook, published in 2006, discusses the differences between 40-year returns and 80-year returns and decides that the 40-year returns, (which exclude the 1930s) are more appropriate for our purposes. The book states that "it appears that observed fat tails are largely due to older history" and "we have more confidence that the more recent averages better estimate expected returns for the near future." Then 2008 dropped a -37% return on us. It will be interesting to see how they address this issue in the next edition.

Jan 22, 2009
Businesses that will fail in 2009
The NYT has described one here. A new startup is going to assemble blog postings and print them in a free weekly paper, supported by advertising. Let me see if I can find all of the problems with this business model as compared to a traditional newspaper or a blog.
- Cost of printing and physical distribution (blogs are virtually free)
- Low responsiveness (blogs can be updated instantly)
- No fact checking or editing (a real newspaper provides those, at least)
- Environmental impact (blogs use less resources)
Basically, The Printed Blog has taken the worst parts of the newspaper business model and combined them with the worst parts of the blog model. And they're going to launch this in the worst economic environment in recent memory. Right.
Jan 21, 2009
Cartoons
Scott Adams seems to have a better understanding of basic economics than most people these days.

Meanwhile, Bill Watterson has succinctly captured the ethos of the American automakers' management:

Meanwhile, Bill Watterson has succinctly captured the ethos of the American automakers' management:
Jan 20, 2009
The winner's curse
This can occur in an auction where the bidders have incomplete information about the true value of the item they're bidding on. If the average of all the bids equals the item's true value, then whoever wins the bid must have overpaid for it, since their bid was the highest, and therefore above average. So the tendency is for the winning bidder to be the bidder with the highest misestimate of value.
Unrelated: In honor of the inauguration, here's some presidential trivia - who was the only U.S. president to successfully pay off the national debt? Andrew Jackson, in 1835. Unfortunately, the panic of 1837 (brought on by massive banking failures) and subsequent depression put an end to that, as the national debt increased ten times in the first year of the depression.
Unrelated: In honor of the inauguration, here's some presidential trivia - who was the only U.S. president to successfully pay off the national debt? Andrew Jackson, in 1835. Unfortunately, the panic of 1837 (brought on by massive banking failures) and subsequent depression put an end to that, as the national debt increased ten times in the first year of the depression.
Jan 18, 2009
Generational risk taking
A recent paper from Berkeley investigates how the risk you take as an investor may be affected by the economic environment you grew up in. Everyone has heard the stories of those who lived through the depression who refuse to trust banks. This paper finds that people who lived through strong stock market returns have an increased percentage of their wealth invested in stocks. Similarly, those who lived through times of high inflation are less likely to invest in bonds. Early experiences of macroeconomic shocks can color someone's investing philosophy for years to come, although they do show that people are still subject to recency bias, although it fades away over time. This approach supports behavioral finance, which runs counter to the traditional theory that all individuals are rational and evaluate past information (historical average returns) equally.
Going forward, will young investors over the last decade return to investing in stocks after the above average volatility experienced starting in 2000? Or will we have to wait for the next generation for the great bull market?
Going forward, will young investors over the last decade return to investing in stocks after the above average volatility experienced starting in 2000? Or will we have to wait for the next generation for the great bull market?
Jan 17, 2009
The promise of equity investing: oversold to the public?
The conventional wisdom for personal investments is that the longer you have until you need the funds, the more risk you can afford to take. A young person with many years until retirement should put a larger percentage of his asset allocation (mix of stocks, bonds, and cash) into riskier asset classes such as equities. If we examine portfolio statistics, this appears to be a reasonable suggestion - while the S&P 500 may be up or down 40% in a year, over 10 or 20 years the average annual return approaches a more reasonable number, and the standard deviation of returns (how much do returns vary each year compared to the mean) also decreases. Since the standard deviation represents risk, people believe they are taking less risk by holding for the long term.
The problem here is that an individual is concerned with his portfolio's terminal value much more than the average of his returns. That is, when you retire in 40 years, how much real purchasing power does your 401(k) provide? Unfortunately, as time increases, the dispersion of your portfolio's terminal value increases, rather than decreases. This means the range of possible values, both extremely high and extremely low, is wider. The mean (expected) value looks pretty good, and there is a lot of upside, but if you end up in the bottom 3 sigmas, you may be disappointed. See graph from John Norstad below.
My argument is not that investors should eschew stocks in favor of something else. It's that average investors may not be fully informed about the risk that they are taking, and may be misled by the apparent effectiveness of time diversification. The investment community has put the best possible spin on portfolio statistics, but may not explain the nuances to an unsophisticated investor. Now that the primary burden of providing for one's retirement has been shifted from social security and pensions to 401(k)s and Roth IRAs, it is more important than ever that people understand what is going on in those accounts.
A detailed explanation and some other arguments are available here. He gets into some other interesting considerations, such as utility theory and the options pricing model. Regarding the latter - if the risk of stocks really declined the longer you held them, put options on the S&P 500 (the right to sell the index at a guaranteed price) should cost less the further out in the future they mature. This is basically a form of portfolio insurance - you buy the option and ensure that you will receive at least a certain price for your stocks. But we observe in the marketplace that the cost of such an option increases with the time to maturity. If you tried to insure the value of your portfolio for the next 10 years this way, it would be prohibitively expensive.

The problem here is that an individual is concerned with his portfolio's terminal value much more than the average of his returns. That is, when you retire in 40 years, how much real purchasing power does your 401(k) provide? Unfortunately, as time increases, the dispersion of your portfolio's terminal value increases, rather than decreases. This means the range of possible values, both extremely high and extremely low, is wider. The mean (expected) value looks pretty good, and there is a lot of upside, but if you end up in the bottom 3 sigmas, you may be disappointed. See graph from John Norstad below.
My argument is not that investors should eschew stocks in favor of something else. It's that average investors may not be fully informed about the risk that they are taking, and may be misled by the apparent effectiveness of time diversification. The investment community has put the best possible spin on portfolio statistics, but may not explain the nuances to an unsophisticated investor. Now that the primary burden of providing for one's retirement has been shifted from social security and pensions to 401(k)s and Roth IRAs, it is more important than ever that people understand what is going on in those accounts.
A detailed explanation and some other arguments are available here. He gets into some other interesting considerations, such as utility theory and the options pricing model. Regarding the latter - if the risk of stocks really declined the longer you held them, put options on the S&P 500 (the right to sell the index at a guaranteed price) should cost less the further out in the future they mature. This is basically a form of portfolio insurance - you buy the option and ensure that you will receive at least a certain price for your stocks. But we observe in the marketplace that the cost of such an option increases with the time to maturity. If you tried to insure the value of your portfolio for the next 10 years this way, it would be prohibitively expensive.
Jan 14, 2009
Word Clouds
There's an interesting web application at Wordle, which allows you to easily create word clouds from text or a blog feed (RSS or Atom). Options include the font, colors, shape, and layout. Here's a word cloud created from a Wall Street Journal article on how banks are going to need more capital.

Jan 11, 2009
Words of the day
Antediluvian (adj.)
1. Extremely old and antiquated.
2. Occurring or belonging to the era before the Flood (as told in the Bible).
[From ANTE + Latin dīluvium, meaning flood.]
Logomachy (noun)
A battle of words.
[From the Greek logos (words) + makhe (battle).]
Terpsichorean (adj.)
Relating to dancing.
[From the Greek terpein (to delight) + khoros (dance).]
1. Extremely old and antiquated.
2. Occurring or belonging to the era before the Flood (as told in the Bible).
[From ANTE + Latin dīluvium, meaning flood.]
Logomachy (noun)
A battle of words.
[From the Greek logos (words) + makhe (battle).]
Terpsichorean (adj.)
Relating to dancing.
[From the Greek terpein (to delight) + khoros (dance).]
Jan 6, 2009
Early derivative contracts
Aristotle wrote about Thales of Miletus, a man who lived around 600 BC and was perhaps one of the first people ever to speculate on commodity prices using options. During the winter, he surmised that the olive crop would be plentiful this year, and bid on the right to use the olive presses during the summer, after the harvest came in. Since it was the off-season, there were no other bidders and he secured the call option quite cheaply. When the crop arrived as he predicted, there was great demand to make olive oil, and he was able to sell the options to the farmers for a tidy profit. This paper discusses in more detail the fair price for an olive press option, applying the Black-Scholes pricing model.
Jan 5, 2009
Refiners' stock prices and the crack spread
The crack spread is a rough measure of an oil refiner's gross profit margin. It measures the difference between the cost of inputs (crude oil) and outputs (gasoline, fuel oil, diesel, etc.). Normally this ratio is expressed as 3-2-1, where 3 barrels of crude yield 2 barrels of gasoline and one of heating oil, although other ratios are also possible. The term "crack" refers to the process of breaking the hydrocarbon molecules in crude oil through the application of either a catalyst (cat cracking) or hydrogen (hydrocracking). Another interest fact: a high complexity refinery can actually output 5-10% more material by volume than it consumes as inputs due to volumetric expansion as lighter molecules are produced.
Since the crack spread is a measure of profitability, one might expect that refiners' stock prices are highly correlated with it. The strange thing in 2008 was that refiners were much more highly correlated with the overall stock market (represented by the S&P 500) than the crack spread. The crack spread even became negative at one point in the year - why would refiners continue to operate only to lose money on every barrel they refine? The answer is that they had hedges which locked in input or output prices at levels other than the currently observed spot prices.
Since the crack spread is a measure of profitability, one might expect that refiners' stock prices are highly correlated with it. The strange thing in 2008 was that refiners were much more highly correlated with the overall stock market (represented by the S&P 500) than the crack spread. The crack spread even became negative at one point in the year - why would refiners continue to operate only to lose money on every barrel they refine? The answer is that they had hedges which locked in input or output prices at levels other than the currently observed spot prices.
Jan 4, 2009
Your state's credit rating
Where does your state fall on the credit rating scale? Interesting that the east coast has a string of AAA ratings, while the west has a cluster of states with no general obligation government bonds at all (those appear to be the states with low population densities). Also noteworthy: states can't declare bankruptcy, while cities and municipalities can. Yields on munis have certainly become more attractive, but I'd look to GO bonds over revenue bonds tied to a specific source of income (they lack the full faith and credit of the governmental entity). From an article in Fortune.

Jan 2, 2009
The 4.4% of the S&P500 that stayed in the green
Only 22 of the 500 stocks in the S&P500 finished 2008 in positive territory. Not surprisingly, we see Wal-Mart, the Dollar stores, and McDonald's on the list, plus several biotech/pharma companies. UST, which sells smokeless tobacco and wine (what a great flavor combination), also posted a gain due to its impending buyout by Altria. A few chemical companies are on the list, probably benefiting from lower oil prices. H&R block made the cut (chalk that one up to death and taxes). And of course Autozone - when the economy slows, people do more car maintenance themselves.
The oddball on this list is Pulte - the news for homebuilders only became more negative during the course of the year. However, it had already been beaten up so badly by the end of 2007 (losing 70% of its value that year) that it was able to stay mostly flat in 2008.

The oddball on this list is Pulte - the news for homebuilders only became more negative during the course of the year. However, it had already been beaten up so badly by the end of 2007 (losing 70% of its value that year) that it was able to stay mostly flat in 2008.

Jan 1, 2009
Firstlight Financial: closed for business?
Firstlight Financial was a leveraged lender started in April of 2007 by a former GE officer, Ron Carapezzi, who took a lot of GE Commercial Finance staff over to the new firm. Ron and several other employees were graduates of GE's Financial Management Program (FMP). The company provided senior debt, second lien and mezzanine debt, structured financings and equity investments. Peaking at over 60 employees, layoffs were reported in April of 2008, reducing headcount to about 15.
Recently I noticed that the website is no longer working, and there is no answer at the listed phone number. Another victim of the credit crunch?
Recently I noticed that the website is no longer working, and there is no answer at the listed phone number. Another victim of the credit crunch?
Subscribe to:
Posts (Atom)